AnalyticaChart 4+
AnalyticaChart 4+

Advanced and clutter free footprint profile chart add-on for NinjaTrader 8. Displays bid and ask volume traded at each price at each bar.Ā All periodicity types are supported ie. Volume, Tick, Range, etc.

Looking for the base AnalyticaChart4? Check it out here:

Step By Step Installation Video

Free Trial Download Link

100% Supported on ALL NinjaTrader 8 License Types; Free, Lease, Lifetime, Proprietary, etc.

Features

  • Unfinished Auction Detection
  • Size Filter
  • Imbalance Detection
  • Bid Volume per Price
  • Stacked Imbalance Highlighting
  • Automatic Absorption Detection and Painting
  • Automatic Derived Areas
  • Volume Profile
  • Bid Volume per Bar
  • Ask Volume per Price
  • Ask Volume per Bar
  • Delta per Bar
  • Bid X Ask, Ask X Bid, Total Volume or Delta Value in Each Cell

Ā 

CertificationCertification

Stacked Imbalances are highlighted in either Cyan or Orange (configurable) to show a strong imbalance of buyers or sellers.
A large number of imbalances in a row is an indication of future powerful movement in that direction.

This strategy shows a basic 20 tick TP/SL on ES with entry on 3 or more stacked imbalances.

screenshot-20220423-at-132804-6000-6500-8000--6000-6500-8000pdf-1650745724193.jpg__PID:7445efdb-876c-44fd-9068-11ccacfed654
screenshot-20220423-at-132818-6000-6500-8000--6000-6500-8000pdf-1650745728584.jpg__PID:2d4e13b4-6cbc-4edc-8f47-701d4c21615e

Delta Divergences are an incredible way to see how the tide of the market will shift before anyone else does.

Here is an example of a way we can use delta divergences to our advantage when trading order flow, we can spot a delta divergence aligned with the current trend, and confirm our entry with a stacked imbalance.

We can also utilize previous absorption to set a "sell wall" in front of our stoploss. This prevents most incidents where price will touch your stoploss and immediately go down. This is the most efficient way to make sure every tick you are risking is utilized to the fullest.

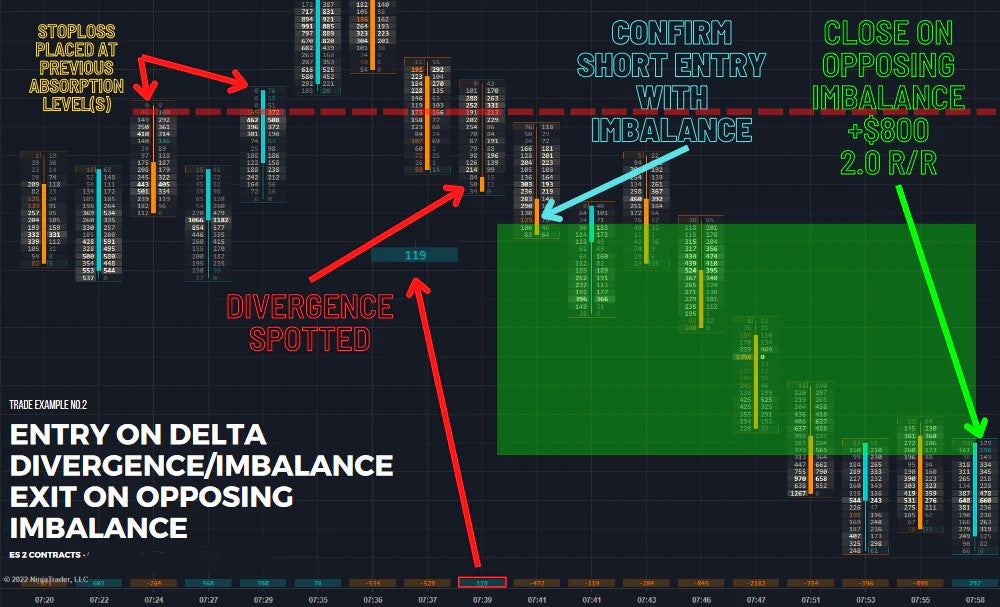
Combine the AnalyticaChart 4 with any strategy to create a powerful hybrid strategy, utilize the chart as a "red flag" indicator. Wait for entries with your normal strategy, and "cut out" bad trades by watching order flow.

1. See a comprehensive, real time, and easy to understand birds eye view over internal market structure.

2. Access to a comprehensive amount of information to create an extremely strong trade thesis without use of traditional indicators
Resilient to market regime change; Bid/Ask structure will always exist in markets, and as long as it does, Order Flow will continue to provide an edge.

3. Real Time: Watch key levels being formed in the moment, stop waiting to find support and resistance levels minutes after they have formed.

4. No conflicting indicators; each one serves a distinct and definitive purpose

parallax

Testimonials

Mike S.

Retail Trader - 15 Yrs. Experience

Using the technique and footprint charting Connor teaches I raised my account NLV 13% TODAY. This is THE best tool available to retail traders and it wasn't always there for us. I've been trading 15 years this coming May 8th (2022). I'm a scalper by nature and always did fairly well but since adding the footprint data charts to my platform (and understanding the data) I have raised my account balance by 51% in just a few weeks. I am also not taking huge risk which, in my opinion, is one of the best qualities of using this tool. It will literally show you where to put your stop based on traded data..... not rules, not books, not trade plans etc. Try it- I know of NO trader who can't benefit by this charting system.

Carson G.

Proprietary Trader

I just passed the evaluation for Earn2Trade with this chart, I've been struggling for a long time to get a consistent edge but the ability to see the market structure with this chart is such a game changer, I'll never trade without it again.

Kent J.

Commodities Trader

"So... 3 weeks with the Volumetric indicator (and trading every day) I have experienced 2 "down days" where I closed Red. 1 was -$296 and the other was -$46. Every other day was seriously Green and it's largely due to installing and learning this indicator and what the shown parameters reflect. I started with a small account since I have accounts elsewhere and in 3 weeks the PNL has grown 29%"